A look at emerging trends in design, infographics and data visualization.
By Stephie Hass
We live in an increasingly visual and interactive society. As infographics replace news articles and Pinterest and Instagram become the new Facebook and Twitter, it’s hard to imagine what modern communication will look like even a year from now. This week’s Society 2.0 highlights creative innovations in news and advertising: from a typeface that can be used in any language, to holograms and data visualizations.
“Google’s state-of-the-art media center a major draw at Republican convention http://fxn.ws/NxvBpY” via Fox News SciTech @fxnscitech
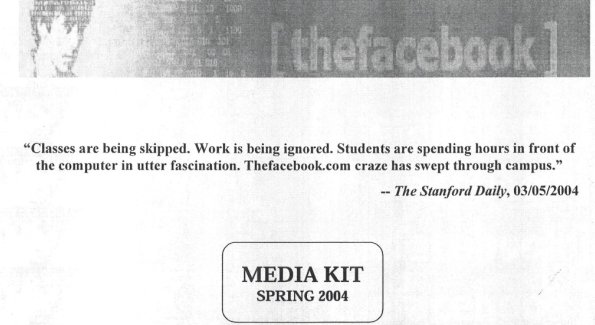
“Very cool! @OgilvyIntel A look at the media kit used to sell ads for “thefacebook” back in 2004 http://www.digiday.com/platforms/how-eduardo-saverin-sold-facebook-ads-in-2004/ …” via Social@Ogilvy @SocialOgilvy
“Are holograms, mind-reading & facial recognition software the future of tech in advertising? http://fb.me/1RbGsQzjK” via Ad 2 DC @Ad2DC
“Nokia has released a typeface that can be used in any language, ‘pure’ http://www.psfk.com/2012/08/nokia-universal-font.html” via The Hyperfactory @thehyperfactory
“Explore multi-screen consumer behaviors in our newest infographic http://goo.gl/YJhHi” via Think with Google @ThinkwithGoogle
“An infographic on how 3D printing works http://htbl.co/RSQYne” via ARCHITECT magazine @architectmag
“Mapmaking, art, or programming? The powerful ways we visualize urban data http://theatln.tc/PwSHbZ” via The Atlantic @TheAtlantic
“Crazy infographic of the day: 160 years of hurricanes plotted form one giant hurricane! http://bit.ly/PLSNP9” via Co.Design @FastCoDesign

